Some interesting Matrix data
I was recently analyzing network traffic on my communications network to see if a campaign against attacks was beneficial in the first part of March. From that, I realized that out of 15,497 servers, the campaign made a noticeable impact on the frequency and type of attack.
I thought that some of you might be interested to visually see what attacks from state actors look like on an encrypted communications network, so I have compiled a variety of graphs from various data sources within my network and what follows is a series of graphs generated using MatPlotLib, along with explanations as to why this data is important and what I've learned from it. Here's some interesting data I thought I'd share.
Cyberattacks rendered based on peer-to-peer disconnections #
This graph visualizes the occurrence of cyberattacks by tracking when multiple domains become simultaneously unreachable, indicating widespread downtime while also naturally filtering out isolated incidents of misconfigurations, power outages, and individual cases of censorship. Cyberattacks with any degree of effectiveness will target multiple servers concurrently, making them stand out on the graphs.
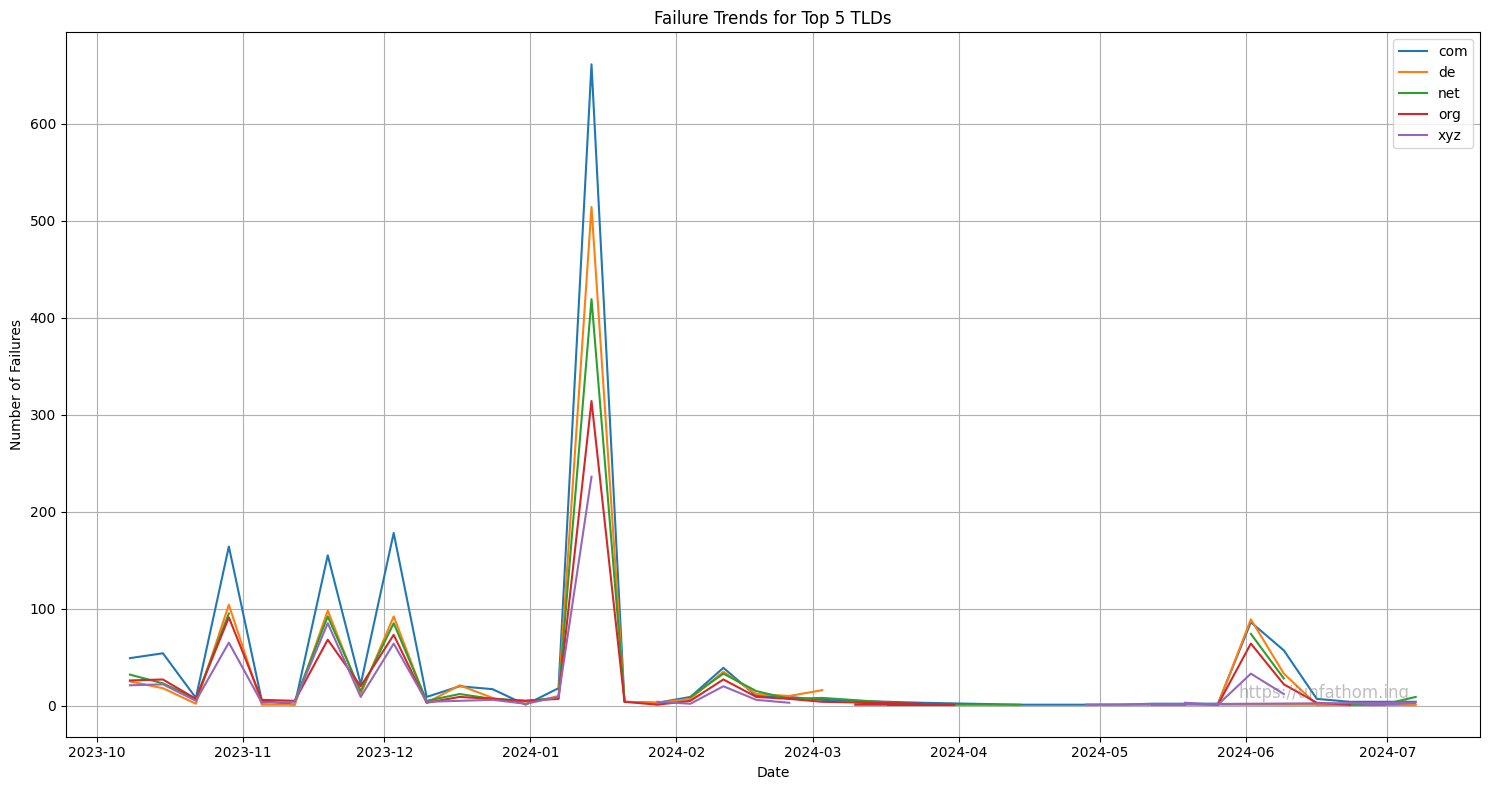
Total failures for top 5 TLDs
com    1616.0
de     1126.0
net    1007.0
org     826.0
xyz     635.0
Percentage change in failures (last 4 weeks vs previous 4 weeks)
com   -100.000000
de     -75.000000
net    -81.818182
org    -50.000000
xyz    -57.142857
TLD distribution (censorship resistance) #
The chart below shows why Matrix is the best protocol for censorship resistant communication. The ability to shut down over 15000 domains from different regions of the world under different governments is an impossible task.
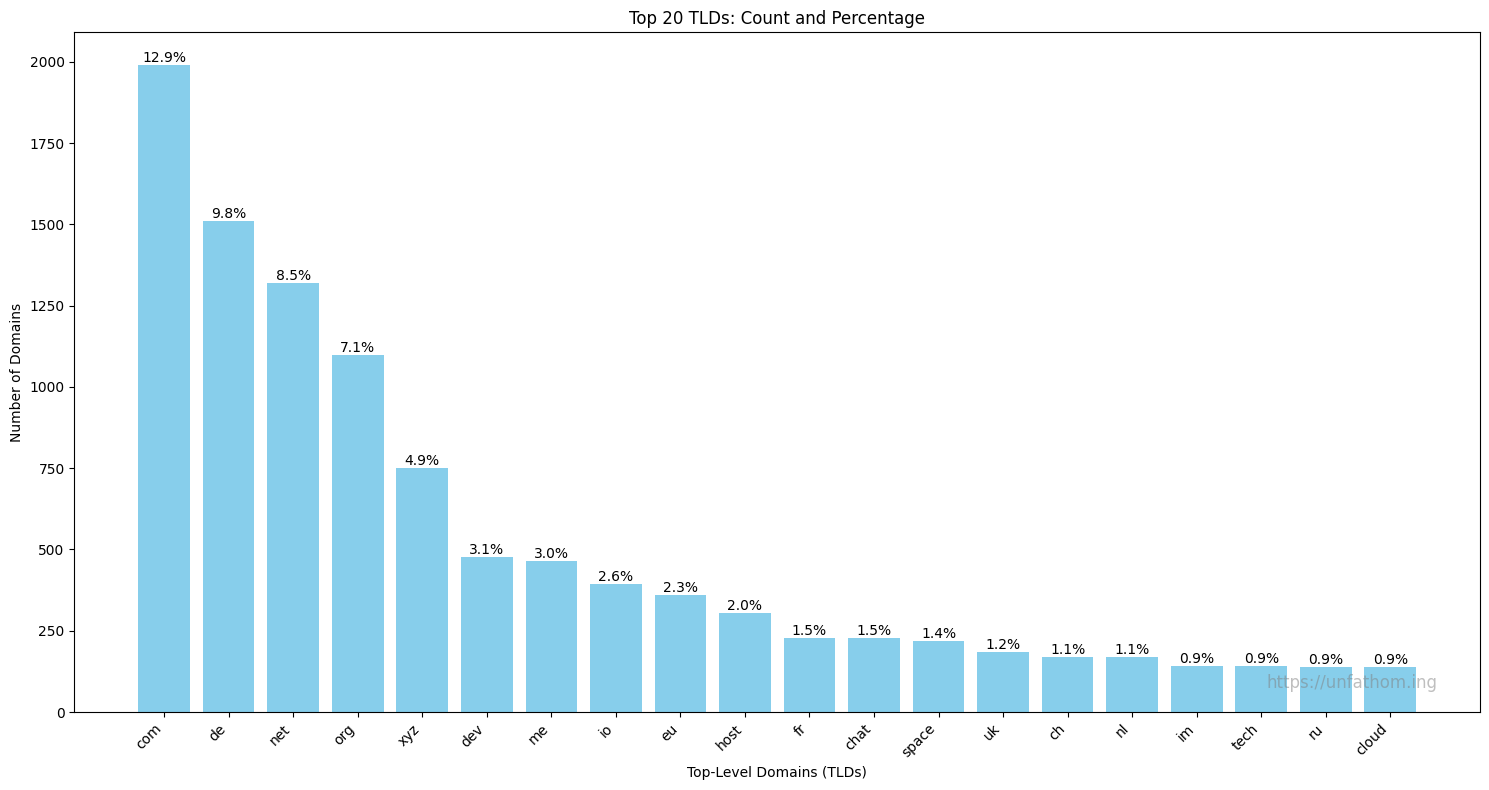
Top 20 TLDs
com: 1991 domains (12.88%)
de: 1509 domains (9.76%)
net: 1319 domains (8.54%)
org: 1098 domains (7.10%)
xyz: 750 domains (4.85%)
dev: 477 domains (3.09%)
me: 464 domains (3.00%)
io: 395 domains (2.56%)
eu: 359 domains (2.32%)
host: 305 domains (1.97%)
fr: 229 domains (1.48%)
chat: 227 domains (1.47%)
space: 219 domains (1.42%)
uk: 184 domains (1.19%)
ch: 170 domains (1.10%)
nl: 168 domains (1.09%)
im: 142 domains (0.92%)
tech: 140 domains (0.91%)
ru: 138 domains (0.89%)
cloud: 137 domains (0.89%)
Total number of domains: 15454
Number of unique TLDs: 418
Tracking potentially malicious (PoMa) people #
Being an organization with a lot of adversaries, we operate our own "Wanted List" of sorts and track, interact with, and gather intelligence data from thousands of users across a dozen platforms by utilizing Matrix bridges and custom clients. Here's the top five:
Number of users on the PoMa list
Telegram users: 4149
Discord users: 914
WeChat users: 82
Signal users: 59
Snapchat users: 6
- Previous: The Chinese keyboard problem
- Next: Principles for a free being